IATA sees passenger demand up 10% and cargo up 3.2% in January

Image courtesy IATA
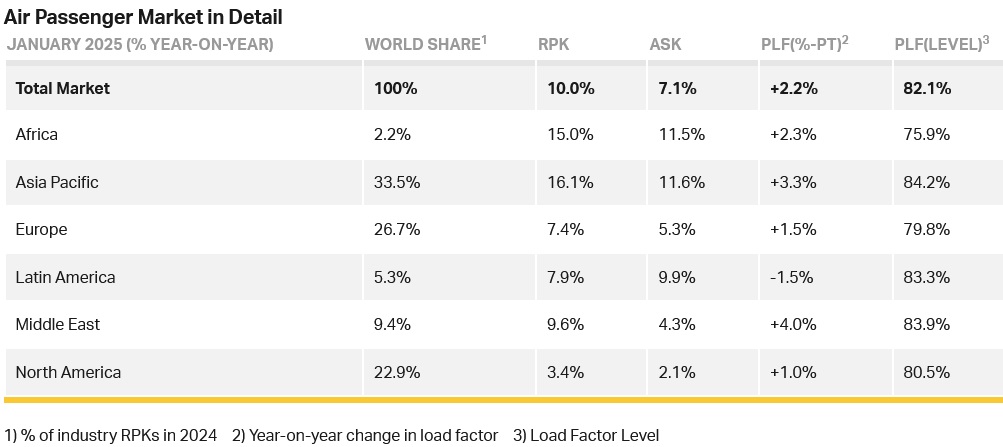
Total passenger demand, measured in revenue passenger kilometres (RPK), was up 10.0% compared to January 2024. Total capacity, measured in available seat kilometres (ASK), was up 7.1% year-on-year. The January load factor was 82.1% (+2.2 ppt compared to January 2024), an all-time high for January.
International demand rose 12.4% compared to January 2024. Capacity was up 8.7% year-on-year and the load factor was 82.6% (+2.7 ppt compared to January 2024), an all-time high for January.
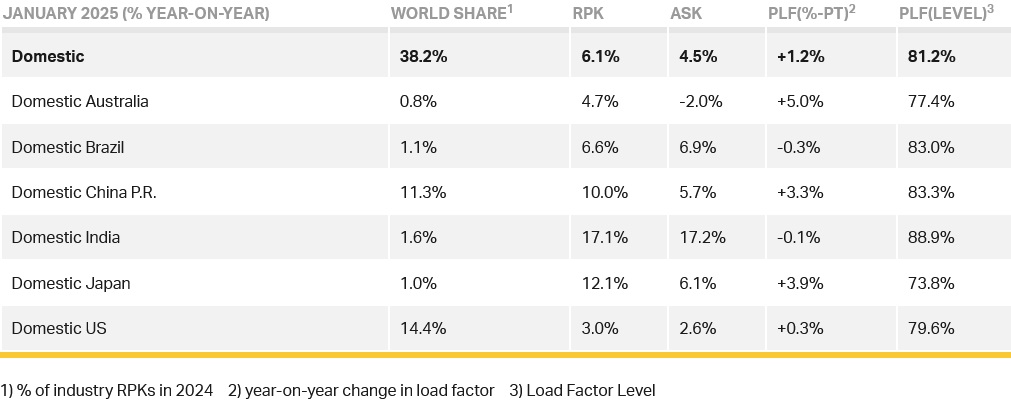
Domestic demand rose 6.1% compared to January 2024. Capacity was up 4.5% year-on-year. The load factor was 81.2% (+1.2 ppt compared to January 2024), an all-time high for January.

Willie Walsh, IATA’s Director General, said: “We’ve seen a notable acceleration in demand this January, with a particularly strong performance by carriers based in the Asia-Pacific region. The record high load factors that accompany this strong demand are yet another reminder of the persistent supply chain issues in the aerospace sector.
“The strong growth in demand aligns with the results of our latest passenger survey (November 2024) in which 94% of travelers indicted that they planned to travel as much or more in the coming 12 months than they did in the past year. Airlines are doing a good job of accommodating growing demand amid fleet and infrastructure constraints with satisfaction levels above 95%, and nearly 80% of travelers agreeing that air travel is good value for money. Choice is an important component of this satisfaction. Some 70% prefer to pay the lowest fare and customize the additional services they need. It is important for regulators to clearly understand that the majority of travelers do not want to pay automatically for services they don’t need.”
Regional Breakdown - International Passenger Markets
All regions showed growth for international passenger markets in January 2025 compared to January 2024, with Asia-Pacific demand particularly strong. All markets except Europe and North America showed strong acceleration in January compared to December 2024. Load factors rose year-on-year in all markets except Latin America.
Asia-Pacific airlines achieved a 21.8% year-on-year increase in demand. Capacity increased 16.5% year-on-year and the load factor was 86.7% (+3.8 ppt compared to January 2024). Traffic from Northeast Asia was particularly strong.
European carriers had an 8.6% year-on-year increase in demand. Capacity increased 6.2% year-on-year, and the load factor was 79.2% (+1.8 ppt compared to January 2024).
Middle Eastern carriers saw an 9.6% year-on-year increase in demand. Capacity increased 4.4% year-on-year and the load factor was 83.8% (+4.0 ppt compared to January 2024). Results in this region have been underpinned by a gradual return of traffic in Israel, and strong performance of the Gulf carriers.
North American carriers saw a 3.8% year-on-year increase in demand. Capacity increased 0.6% year-on-year, and the load factor was 81.8% (+2.6 ppt compared to January 2024).
Latin American airlines saw an 12.9% year-on-year increase in demand. Capacity climbed 15.5% year-on-year. The load factor was 84.3% (-1.9 ppt compared to January 2024).
African airlines saw a 14.9% year-on-year increase in demand. Capacity was up 11.2% year-on-year. The load factor rose to 75.9% (+2.4 ppt compared to January 2024).
Domestic Passenger Markets
Domestic RPK increased 6.1% over the previous year, reflecting particularly strong growth in India (despite engine issues for some carriers), Japan and China. China’s growth of 10.0% was driven by record numbers traveling for the Lunar New Year. Load factors continued to edge up (+1.2ppt) to hit a record high of 81.2% for January.
Cargo
IATA data for January 2025 global air cargo markets showed total demand, measured in cargo tonne-kilometres (CTK), rose by 3.2% compared to January 2024 levels (3.6% for international operations) for an 18th consecutive month of growth, whilst capacity, measured in available cargo tonne-kilometres (ACTK), increased by 6.8% compared to January 2024 (7.3% for international operations).
Willile said: "January marked 18 consecutive months of growth for air cargo, but the month’s 3.2% year-on-year growth is a moderation from double-digit peaks in 2024. Similarly, yields, while still above January 2024 levels, saw a 9.9% decline from December as cargo load factors also declined by an average of 1.5 percentage points. While external factors such as trade growth, declining fuel costs and expanding e-commerce remain positive for air cargo, it is important to closely watch the evolution of market conditions at this time. In particular, the wild card is the potential for tariff-driven trade policies from the US Trump Administration. Fortunately, the air cargo industry is well practiced at dealing with shifts in the operating environment."

Several factors in the operating environment should be noted:
- Year-on-year, industrial production rose 2.6% in December. Global goods trade grew for a ninth consecutive month, reporting a 3.3% increase in December.
- The Purchasing Managers Index (PMI) for global manufacturing output was above the 50-mark for January, indicating growth. At 50.62, this was the highest reading since July 2024. The PMI for new export orders rose to 49.37, remaining just shy of the 50-mark, which is the growth threshold.
- In January, consumer inflation in the US and in Europe both rose by 0.1 percentage point to 3.0% and 2.8% respectively. Chinese consumer inflation rebounded to 0.5% in January, after progressively falling to 0.1% in the previous four months.
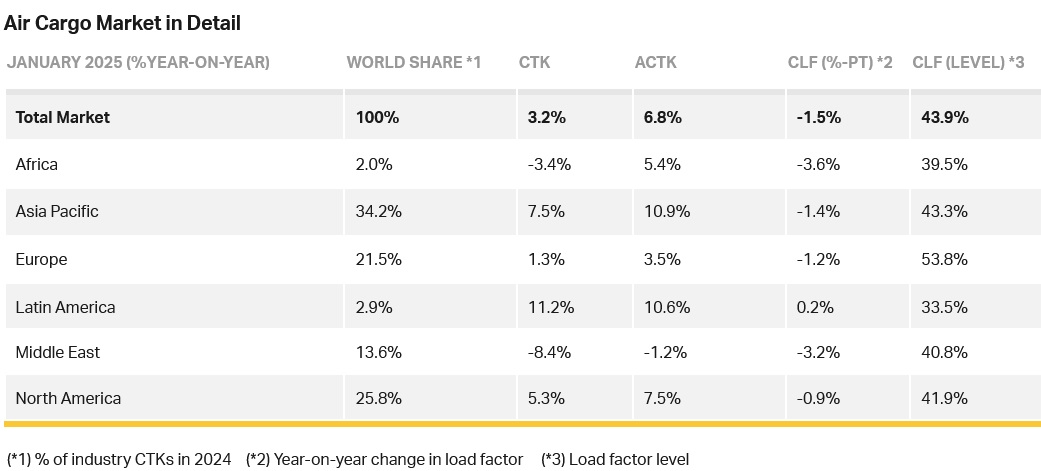
Asia-Pacific airlines saw 7.5% year-on-year demand growth for air cargo in January. Capacity increased by 10.9% year-on-year.
North American carriers saw 5.3% year-on-year demand growth for air cargo in January. Capacity increased by 7.5% year-on-year.
European carriers saw 1.3% year-on-year demand growth for air cargo in January. Capacity increased 3.5% year-on-year.
Middle Eastern carriers saw 8.4% year-on-year demand decrease for air cargo in January, the slowest among the regions. Capacity decreased by 1.2% year-on-year.
Latin American carriers saw an 11.2% year-on-year increase in demand growth for air cargo in January, the strongest growth among the regions. Capacity increased 10.6% year-on-year.
African airlines saw a 3.4% year-on-year decrease in demand for air cargo in January. Capacity increased by 5.4% year-on-year.
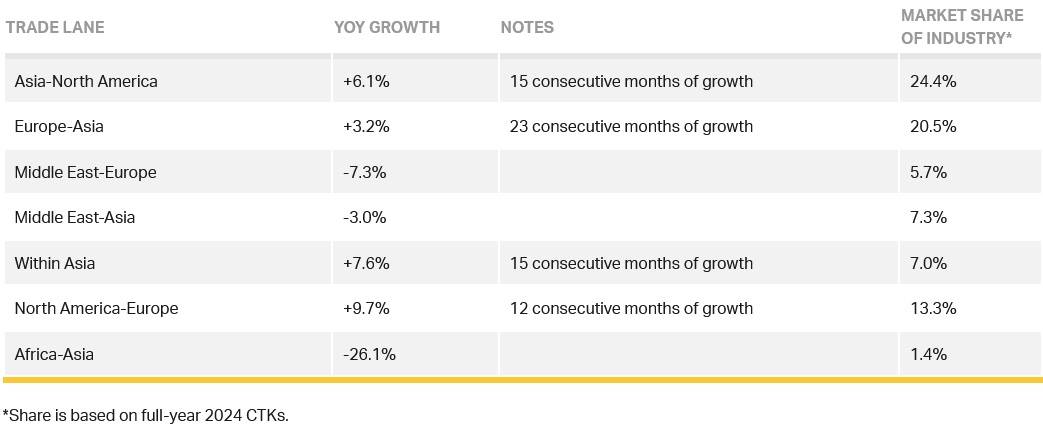
Trade Lane Growth: Most international routes experienced growth in January. Airlines are benefiting from rising e-commerce demand in the US and Europe amid ongoing capacity limits in ocean shipping.